Configuring a Report
You can add and configure a report to an existing tool.
Procedure
- Drag the Report tool from the toolbox and drop it above or below the existing tool.
- Configure the following fields:
- Name: This is the name of the report configuration, and is what will be displayed in the 'Report Source' drop down of any tools that it is linked to.
- Filter: By default the report will be filtered by previous criteria, in other words it will display the segment that is available to it. Additional filters can be added with this option that are unique to the report configuration and which can be joined with previous criteria using the usual 'and', 'or ','exclude' join options. If multiple filters have been added, check the ones that you wish to include in the current iteration of the grid and be sure to set the join option of each. Unchecked filters will be ignored.
- Advanced options: You can expand these options to enable you to select the type of row and column axes that you want to display on grids or charts.
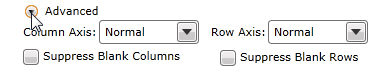
- Column / Row Axis: These settings control the combinations of dimension values that are displayed on a grid or chart, and are applied prior to the grid filter. The default 'Normal' settings create an inferred hierarchy in which combinations that cannot exist in the data are removed. For example, when the Row Axis is set to 'Normal', a row containing a combination of Gender='Male' and Title = 'Mrs' would not be displayed. However, the 'Complete' setting displays all data combinations and if selected, would display the Gender="Male" and Title="Mrs" row.
- Suppress Blank Columns / Rows: when selected , these options prevent columns or rows that only contain zero values from being displayed. These settings are applied after the report filter.
- Add
Rows,
Columns, or
Measures:
| Note: |
You can add at least one measure, but you can configure a single row or single column, or add a row and a column to the report. |
- Rows: You can add a row dimension by dragging from the
Data Explorer , or you can use the
Create new drop-down to select an existing template, or to select another tool to engineer a column.
- Columns: You can add a column by dragging from the Data Explorer, or you can use the
Create new drop-down to select an existing template, or to select another tool to engineer a column.
- Display Nulls :
Nulls are disabled by default; check this box if you would like them to be displayed on the chart.
- Display Subtotals: This setting does not apply to chart reports but can be used if a saved report configuration will be used with a grid.
- Sort: Select the sort basis if one is required.
- MeasureSelect the measure that will apply to this column. Measures will only be available to select once they have been created.
- Included Values: Select values to include in the selection, separated by a carriage return. Including a single value will effectively exclude all other options
- Excluded Values: Select values to exclude from the selection, separated by a carriage return.
- Measures : This option allows you to define the basis of the report, that is what you are actually measuring. It could be a simple count of customer, household or order, or it could be a calculated measure like a mean, or the sum of a database column. For a simple count, select a function of Count and from the
Source drop-down select the unique key column from the relevant table - Household ID, URN and so on. For more advanced measures, select a function from Sum, Average or Standard Deviation and then select the Source column that the function will be based on. Note that multiple measures can be added to a report allowing the user to compare results.
- The
Visible check box is intended for use with calculated measures where one measure might be used by another, but wouldn't be displayed on its own in the final report. In this case you would uncheck the box.
- Filter: By default reports will be filtered by the report level filter (if one exists). It is possible to add additional filters at measure levels that are unique to that measure and which will be AND'd with the report filter by default. Where multiple measures have been added to a report, then each can be filtered differently allowing comparisons to be made.
- To add a measure filter, first clear the
Report Filter default by clicking the cross icon. If you then click the drop-down you are able to drag and drop filters or click the
Create new menu to build up the filter from the available options.
- Format: Select the required number format using the numeric format helper.
|
|